

Latest Growth Data for SME’s
 3rd July 2026
We now have enough data to re-assess the 2026 financial health of our SME business clients.
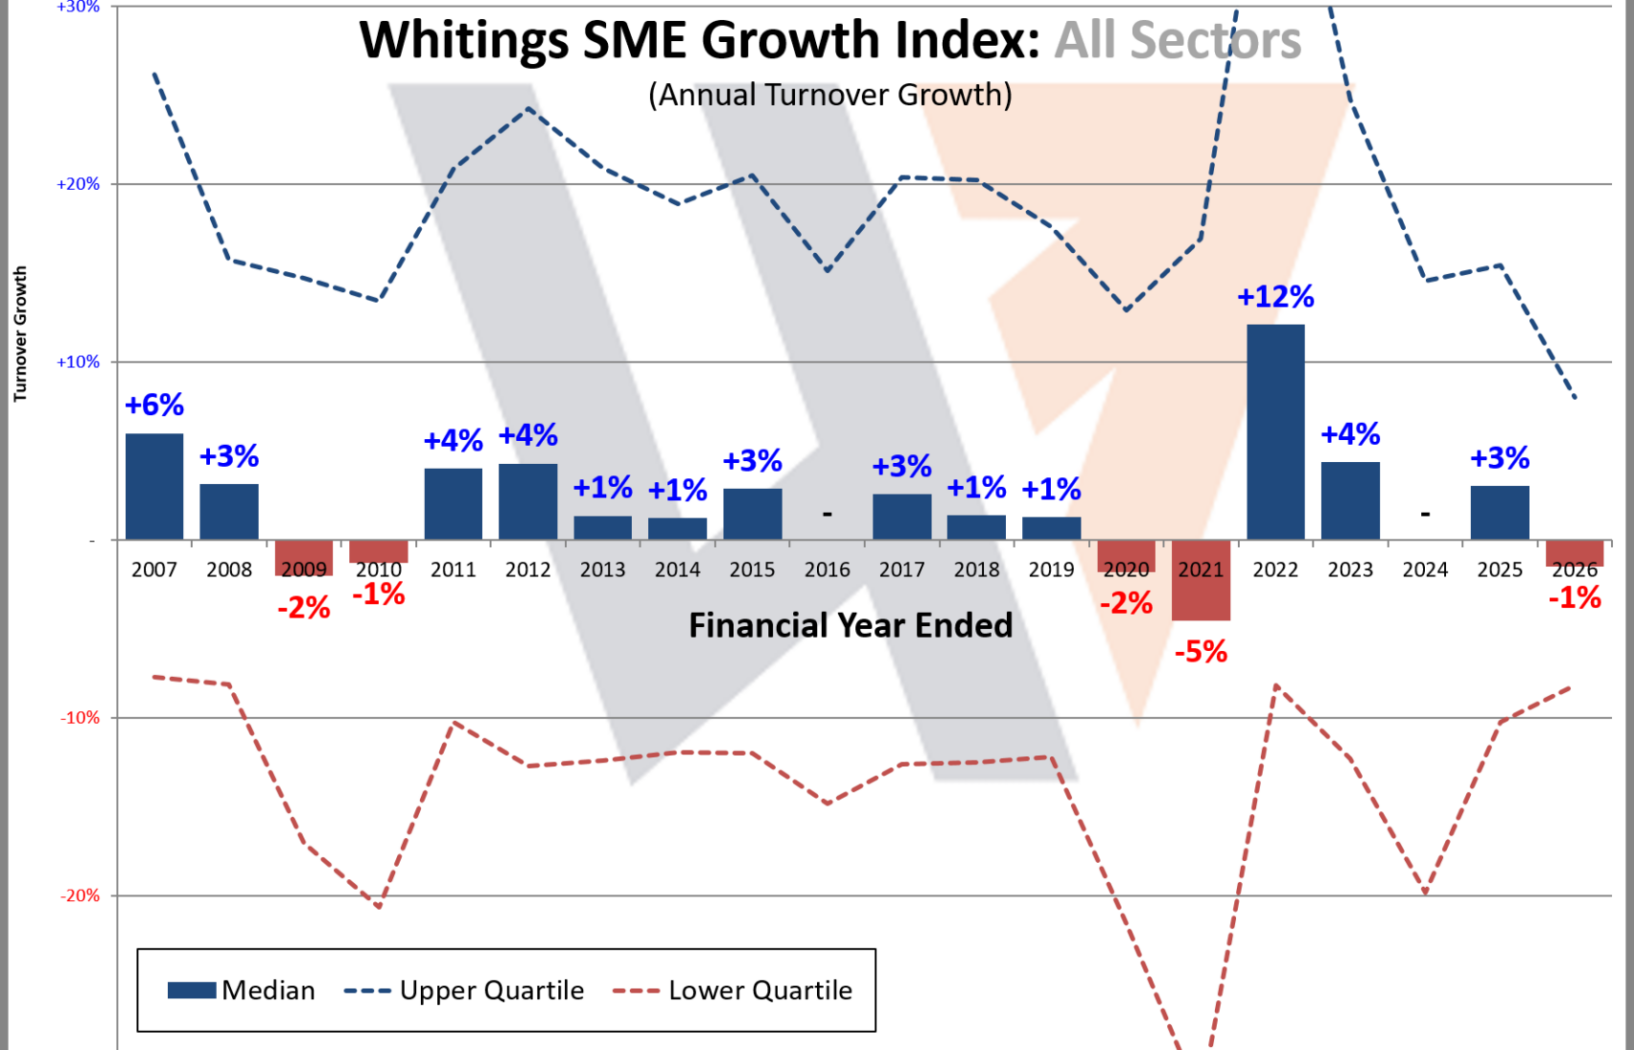
Following the April 2025 double inflation increases in National Minimum Wage and higher Employer’s NIC rates, SME’s have had new ‘un-controllables’ to deal with. As business owners try to re-balance their books, all of these additional payroll costs have real consequence; resulting in restructured operational spends and cancelled discretionary spends. All of this dampens business confidence which, in turn, slows down the circular movement of commerce within the economy and results in lower overall growth (currently shown as -1% for 2026 in the graph above). Technically, is this a recession? Probably too small a data set to be statistically significant at the moment. But it is not looking great out there and clearly we have more political uncertainty ahead.
It is acknowledged that accounting data, by its very definition, is a summary of looking backward, so the trends disclosed in our SME growth index are probably 6 to 9 months out of date.
Reasons behind trends shown in the above graph
2026 | -1.5% (Confidence reduced following decisions of new not business-friendly Government)
2025 | +2.7% (Back to normal inflationary growth)
2024 | Nil% (Stagnation, partly relating to Jul-24 general election)
2023 | +4.4% (Good steady growth, partly due to businesses passing on high inflation costs caused by Feb-22 Ukraine war)
2022 | +12.1% (Post Covid ‘revenge spending’ and passing on high inflation costs caused by Feb-22 Ukraine war)
2021 | -4.5% (Covid year 2)
2020 | -1.8% (Covid year 1 and Jan-20 Brexit implementation)
2019 | +1.3% (Anticipation of Jan-20 Brexit implementation)
2018 | +1.4% (Anticipation of Jan-20 Brexit implementation)
2017 | +2.6% (Normal steady year)
2016 | Nil% (Anticipation and aftermath of Jun-16 Brexit vote)
2015 | +2.9% (Anticipation of Jun-16 Brexit vote)
2014 | +1.2% (Anticipation of Jun-16 Brexit vote)
2013 | +1.4% (Aftermath of double dip recession)
2012 | +4.3% (Normal inflationary growth, despite double dip recession at national GDP level)
2011 | +4.0% (Normal growth, despite fragile recovery)
2010 | -1.3% (Post UK credit crunch)
2009 | -2.0% (Global financial crisis)
2008 | +3.1% (Normal inflationary growth)
2007 | +6.0% (End of 15 year period of solid growth)