

Latest Growth Data for SME’s
 1st October 2026
As we move out of Q3 for 2026 we can renew our assessment of the current financial health of our SME business clients.
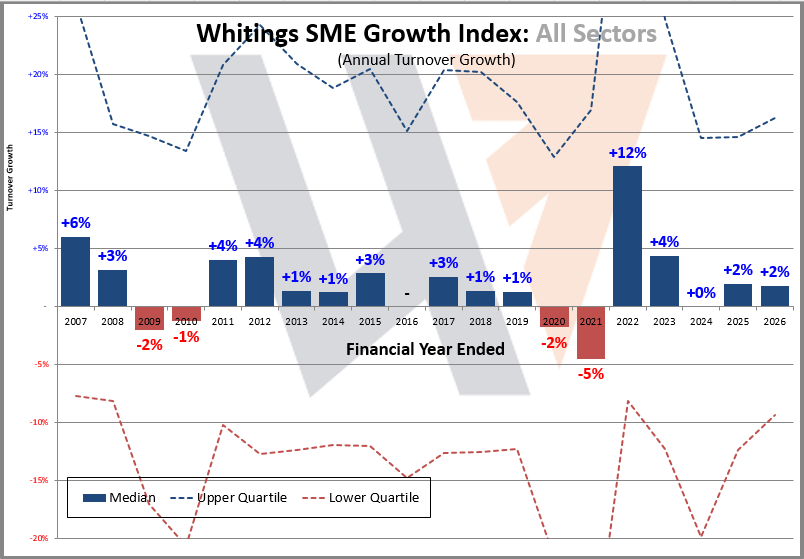
The early years of the change in Government have resulted in new headwinds for SME businesses, including above inflation increases in National Minimum Wage and higher Employer’s NIC rates. This, along with global inflationary pressures, initially dampened business confidence in 2026, but we are now seeing early signs of a return to normality, with year-on-year turnover growth currently showing as +1.8%.
It is acknowledged that accounting data, by its very definition, is a summary of looking backward, so the trends disclosed in our SME growth index are always a bit out of date.
Reasons behind trends shown in the above graph
2026 | +1.8% (Confidence ‘wobbled’ by a not business-friendly newish Government)
2025 | +2.0% (Back to normal inflationary growth + catch-up from 2024)
2024 | Nil% (Stagnation, partly relating to Jul-24 general election)
2023 | +4.4% (Good steady growth, partly due to businesses passing on high inflation costs caused by Feb-22 Ukraine war)
2022 | +12.1% (Post Covid ‘revenge spending’ and passing on high inflation costs caused by Feb-22 Ukraine war)
2021 | -4.5% (Covid year 2)
2020 | -1.8% (Covid year 1 and Jan-20 Brexit implementation)
2019 | +1.3% (Anticipation of Jan-20 Brexit implementation)
2018 | +1.4% (Anticipation of Jan-20 Brexit implementation)
2017 | +2.6% (Normal steady year)
2016 | Nil% (Anticipation and aftermath of Jun-16 Brexit vote)
2015 | +2.9% (Anticipation of Jun-16 Brexit vote)
2014 | +1.2% (Anticipation of Jun-16 Brexit vote)
2013 | +1.4% (Aftermath of double dip recession)
2012 | +4.3% (Normal inflationary growth, despite double dip recession at national GDP level)
2011 | +4.0% (Normal growth, despite fragile recovery)
2010 | -1.3% (Post UK credit crunch)
2009 | -2.0% (Global financial crisis)
2008 | +3.1% (Normal inflationary growth)
2007 | +6.0% (End of 15 year period of solid growth)